


Case Study
Product Validation through User Satisfaction & Ease-of-Use Indices for the StellarGens LMS (B2B) Platform.
Project Scope
System Usability Scale (SUS)
Company (Dummy)
StellarGens
Business Field
Edutech
Phase 1: Introduction

This segment focuses on gaining a deep understanding of the problems and needs to be addressed, while clearly defining the research direction and boundaries.
A.
Company Profile
StellarGens (PT Aksara Stellar Generations) is a Jakarta-based edutech and outsourcing startup focused on professional capability development. Its flagship services include training, certification, and human resource solutions. Through innovative strategies, StellarGens empowers organizations and individuals to remain relevant amidst dynamic digital transformations across various industrial sectors.
B.
Business Case
StellarGens is preparing to enter the competitive B2B-Corporate Training market, where cost-effectiveness and performance impact—driven by a Learning Management System (LMS) are top priorities. To prevent low adoption rates caused by complex systems that undermine ROI, StellarGens must conduct comprehensive testing to prove that its product is market-ready and offers a seamless user experience.
C.
Problem Statement
The B2B challenge for StellarGens lies not in its features, but in a complexity that hinders adoption. Without objective quantitative indicators (testing), there is a risk of subjective bias, skyrocketing support costs, and non-renewal of contracts because the system is counter-intuitive and fails to be solution-oriented.
D.
Research Objective
The objective of this research is to validate the viability of the StellarGens LMS to achieve a solid Product-Market Fit, including:
1.
Establishing a Baseline Usability Score
Obtaining a quantitative score (SUS Score) as a benchmark for product quality.
2.
Identifying User Friction Points
Identifying specific workflow segments with the highest user difficulty levels.
3.
Improving the Accuracy of Feature Investment Decisions
Prioritizing UX design improvements before a comprehensive launch.
4.
Providing Sales Enablement Data
Providing scientific validation data for the Sales team to convince B2B prospects of the system's standardized ease-of-use.
Phase 2: Research Design
This segment focuses on the research planning and execution process, serving as a framework for data collection and analysis.
A.
Research Methods
A comprehensive overview of the framework and methodology used to collect data, ensure accurate findings, and objectively validate user needs.
Research Methods
Mix-Methods
The research utilizes an Evaluative approach, moving beyond simple feedback collection to actively observe user responses to the system.
Primary Method
Quantitative Method
Focusing on acquiring a numerical score through the SUS questionnaire.
- Metric
:
SUS Score (0-100)
- Analysis
:
Descriptive Statistics (Mean and Percentiles).
Supporting Method
Qualitative Method
Integrated with Usability Testing to observe and analyze user behavior.
- Method
:
Think-Aloud Protocol
- Analysis
:
Identifying the pain points causing a low SUS Score.
B.
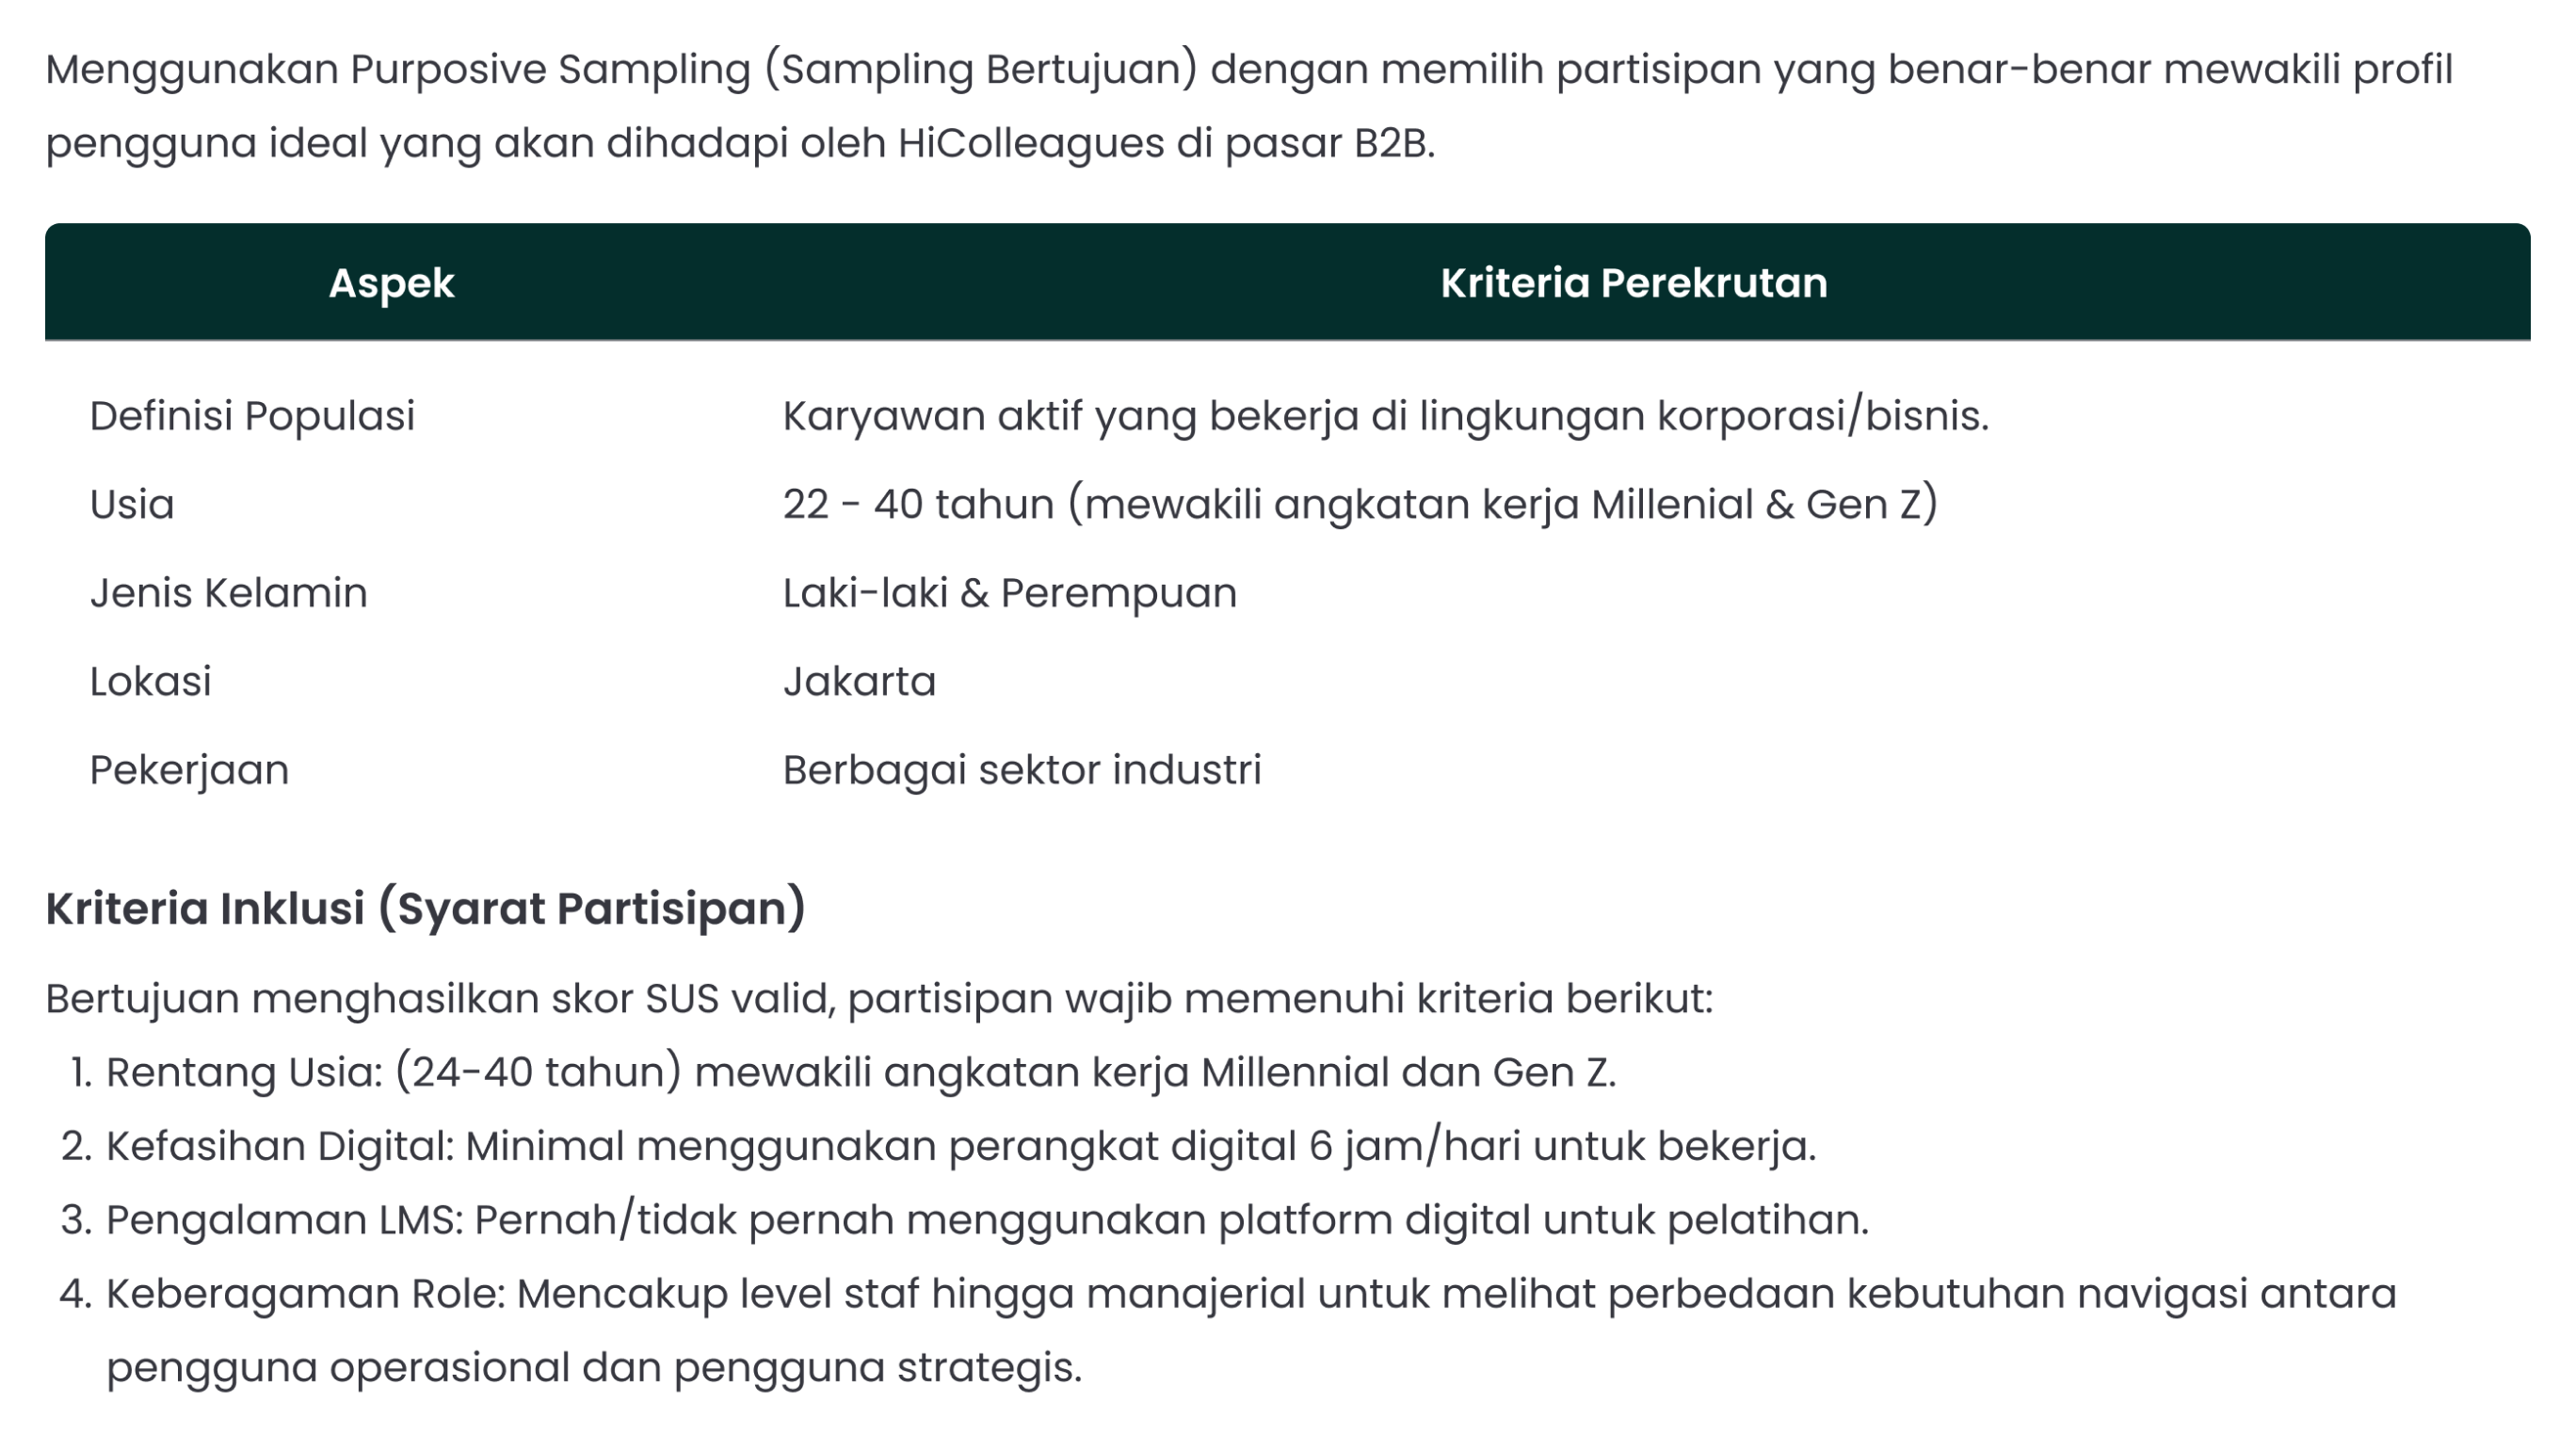
Population & Sample
Defining target user profiles and participant criteria to ensure that the collected data remains relevant to the product ecosystem.
C.
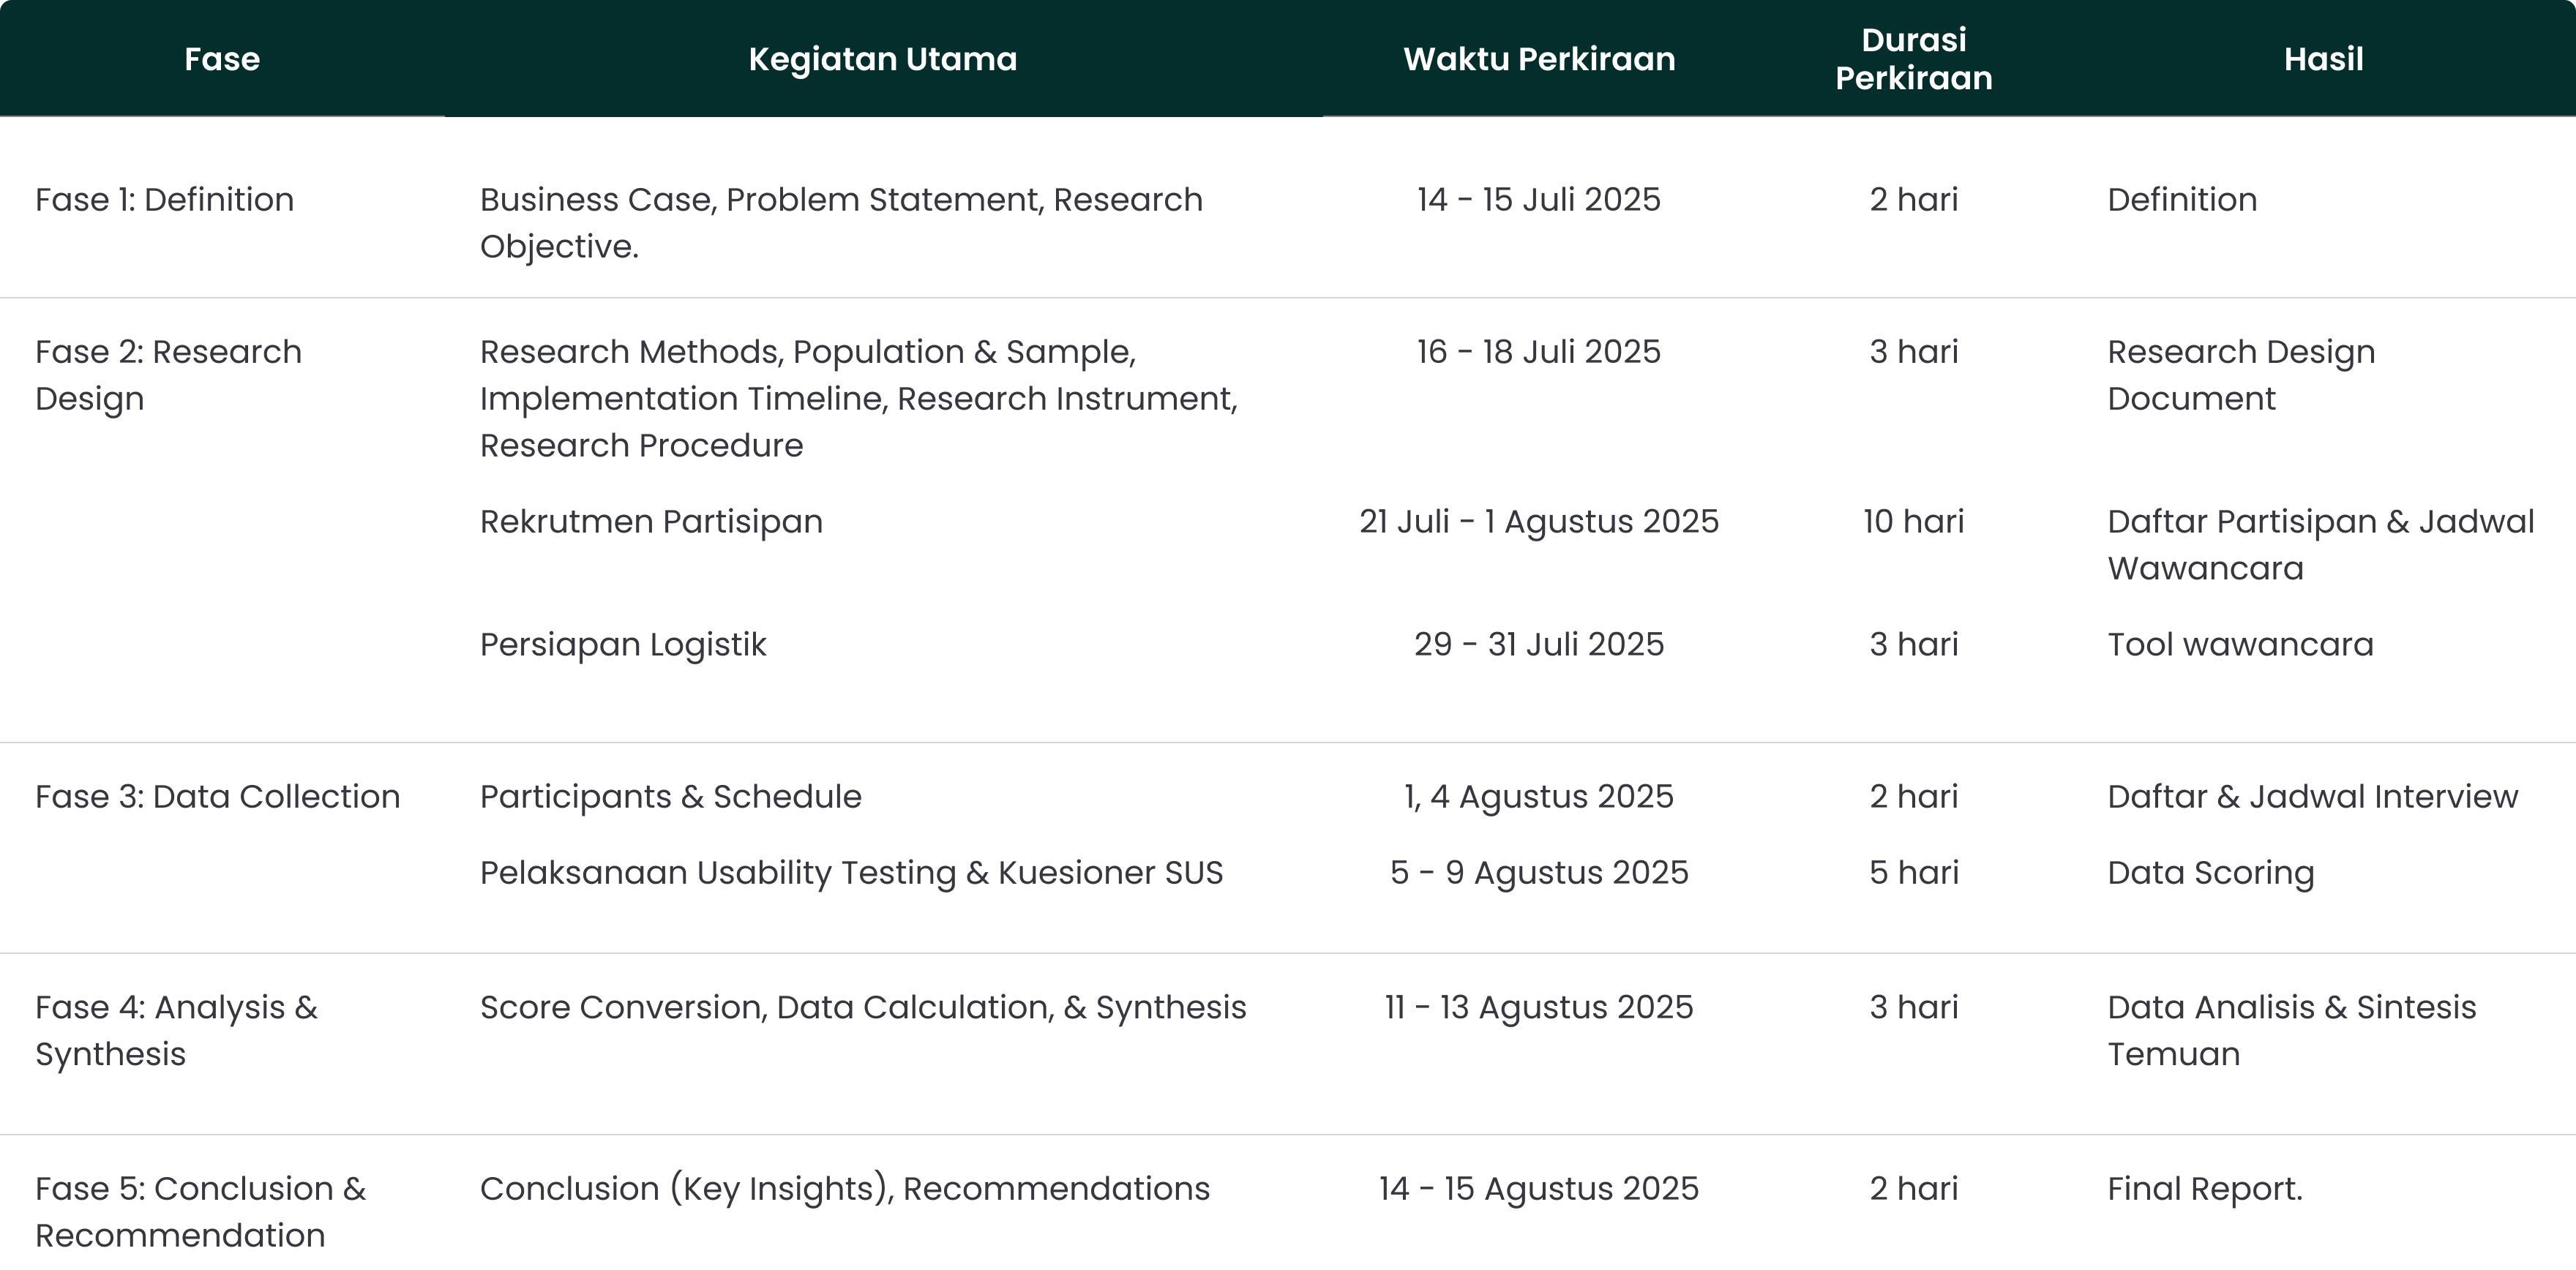
Implementation Timeline
A detailed work plan mapping out every research phase, from preparation to final reporting, to ensure the project stays on schedule.
D.
Research Instrument
A list of tools and structured guides used for consistent data collection, ensuring that every participant interaction yields valid and measurable information.
Usability Testing (Tasks)
1.
Melakukan Login & menemukan modul pelatihan.
2.
(Learning Interaction) User dapat mengeksplorasi jadwal pelatihan, melakukan presensi, mengakses materi, & menyelesaikan evaluasi pelatihan.
3.
Mengakses Training Progress, Assessment & Certificate.
System Usability Test Questionnaires
Instrument 10 pernyataan baku yang diisi dengan Skala Linkert (1-5):
1.
Saya rasa saya akan sering menggunakan platform ini.
2.
Saya merasa platform ini rumit tanpa alasan yang jelas.
3.
Saya rasa platform ini mudah digunakan.
4.
Saya rasa saya akan membutuhkan bantuan dari orang teknis untuk dapat menggunakan platform ini.
5.
Saya merasa berbagai fungsi dalam platform ini terintegrasi dengan baik.
6.
Saya rasa ada terlalu banyak ketidakkonsistenan dalam platform ini.
7.
Saya membayangkan kebanyakan orang akan belajar menggunakan platform ini dengan sangat cepat.
8.
Saya merasa platform ini sangat sulit/canggung untuk digunakan.
9.
Saya merasa sangat percaya diri saat menggunakan platform ini.
10.
Saya perlu mempelajari banyak hal sebelum saya bisa mulai menggunakan platform ini.
E.
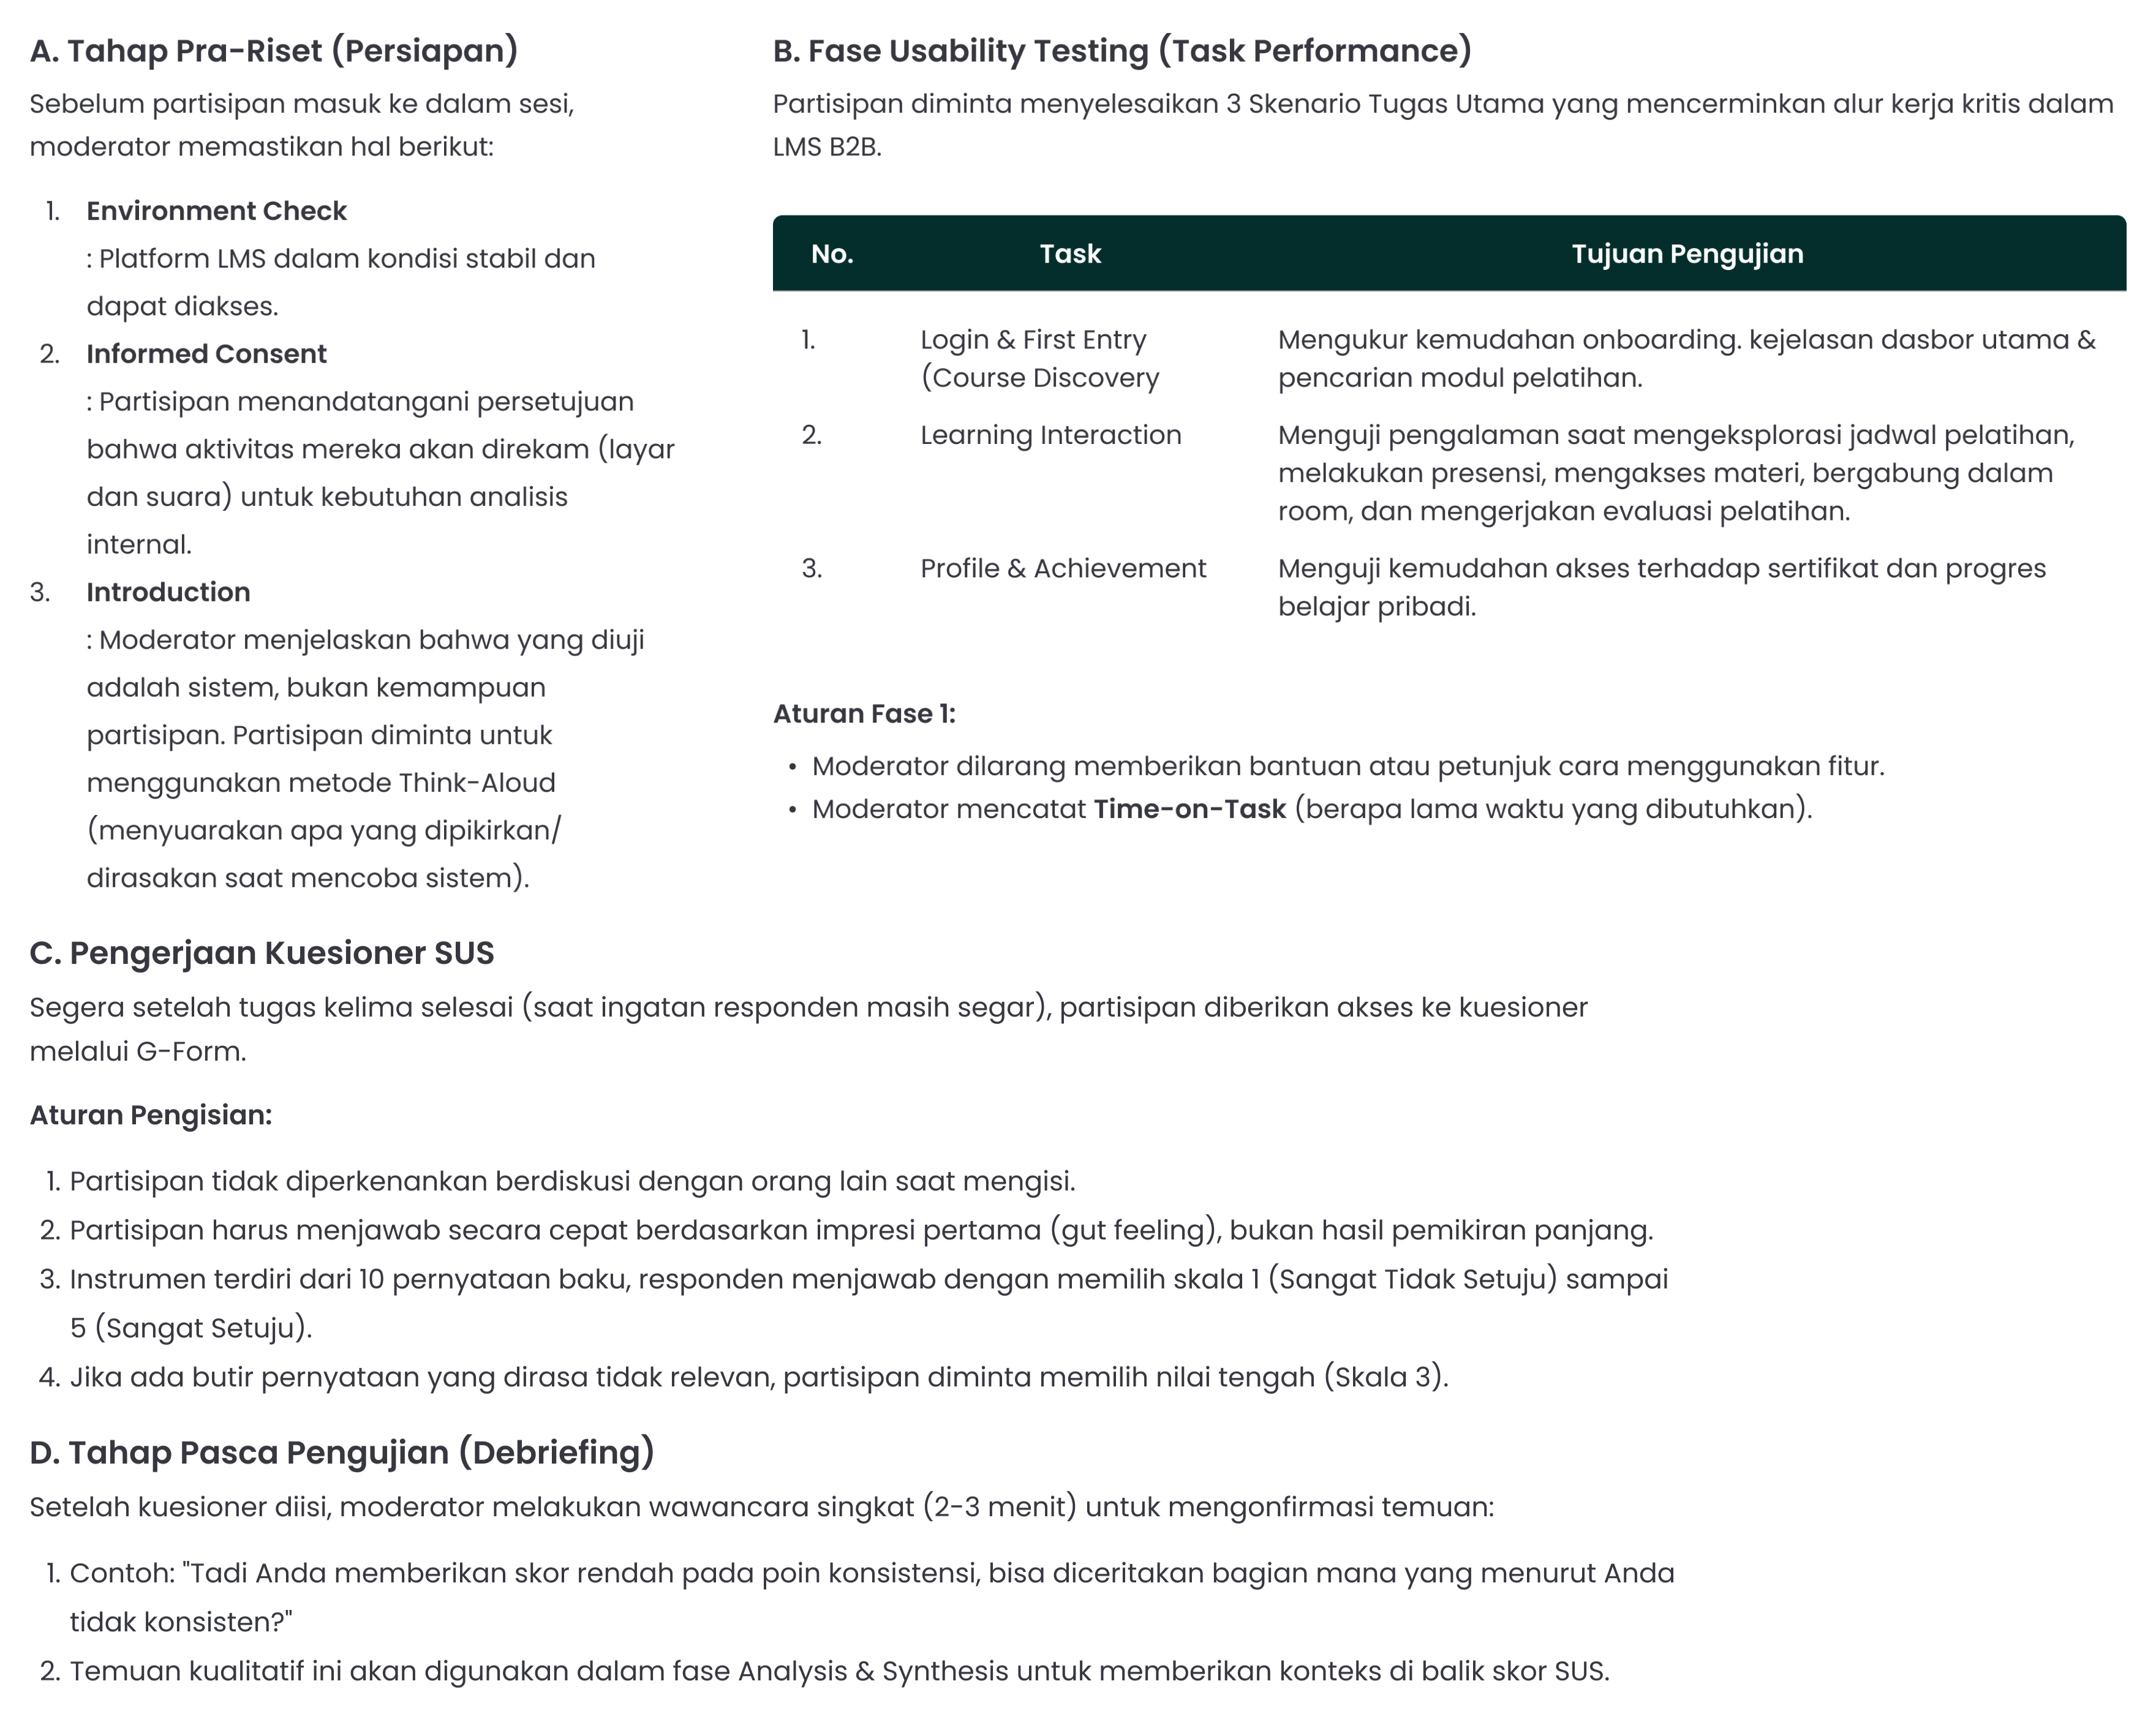
Research Procedure
A series of systematic steps conducted in sequence, from preparation to data processing, to ensure integrity and consistency throughout the research process.
Phase 3: Data Collection
This segment focuses on the implementation of the research design to acquire and collect data.
A.
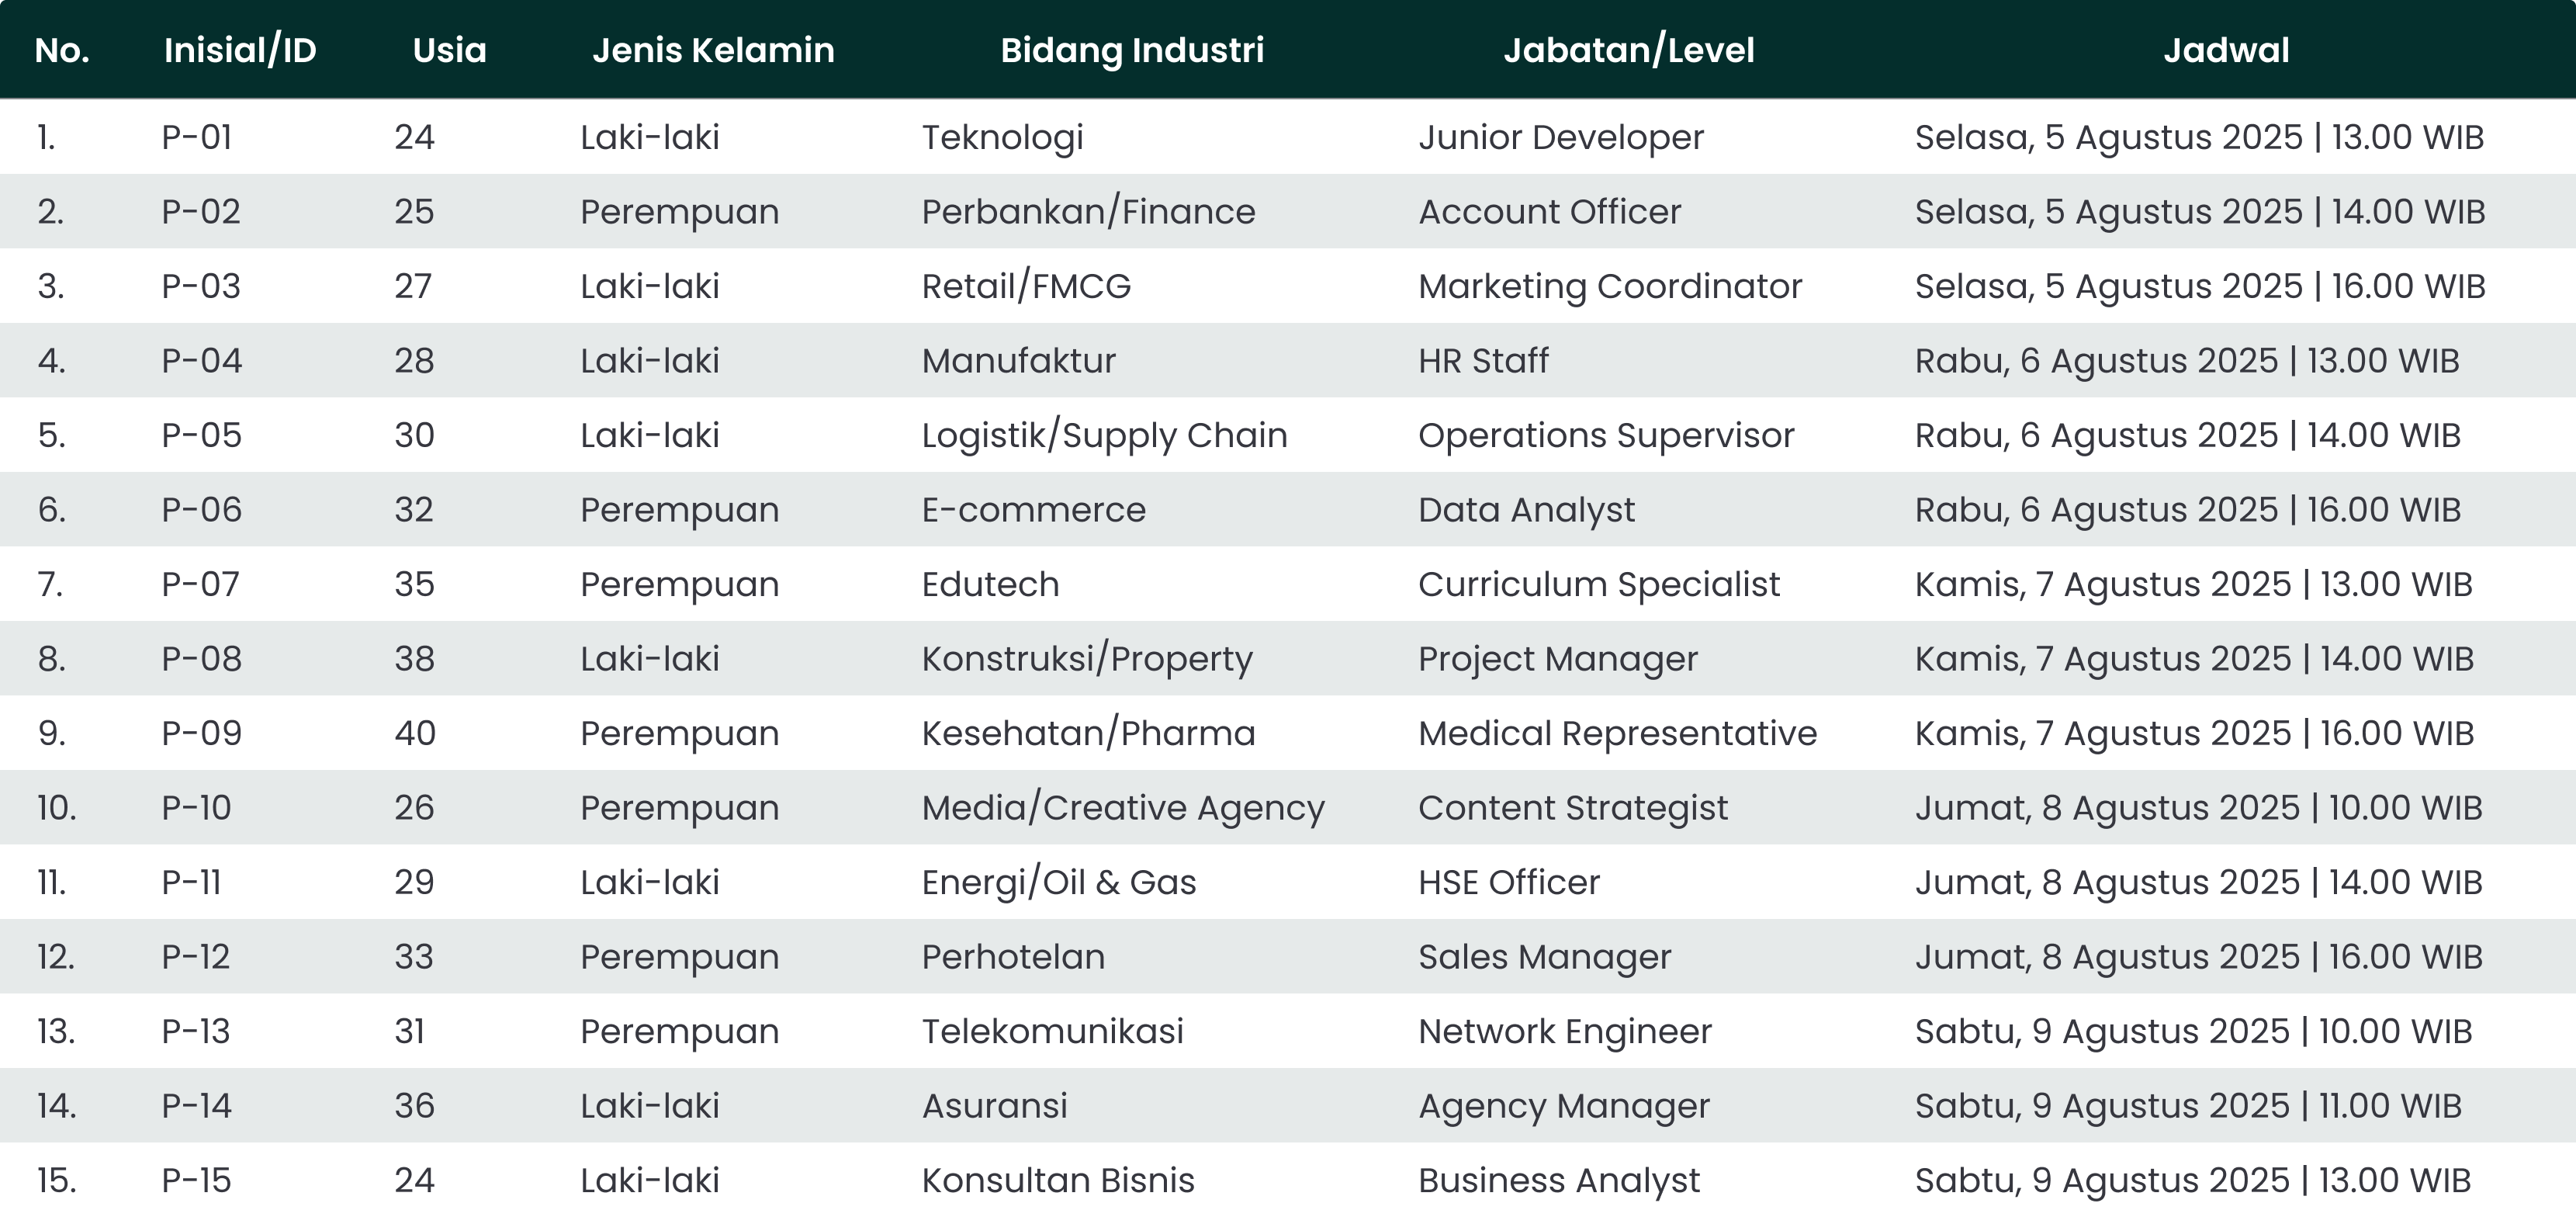
Participants & Research Schedule
List of participants and a summary of the research session schedule to ensure efficient data collection.
The following is the distribution of 15 participants, strategically selected to cover a diverse range of industry sectors and an age bracket of 24–40 years:
B.
Data Scoring
B. 1.
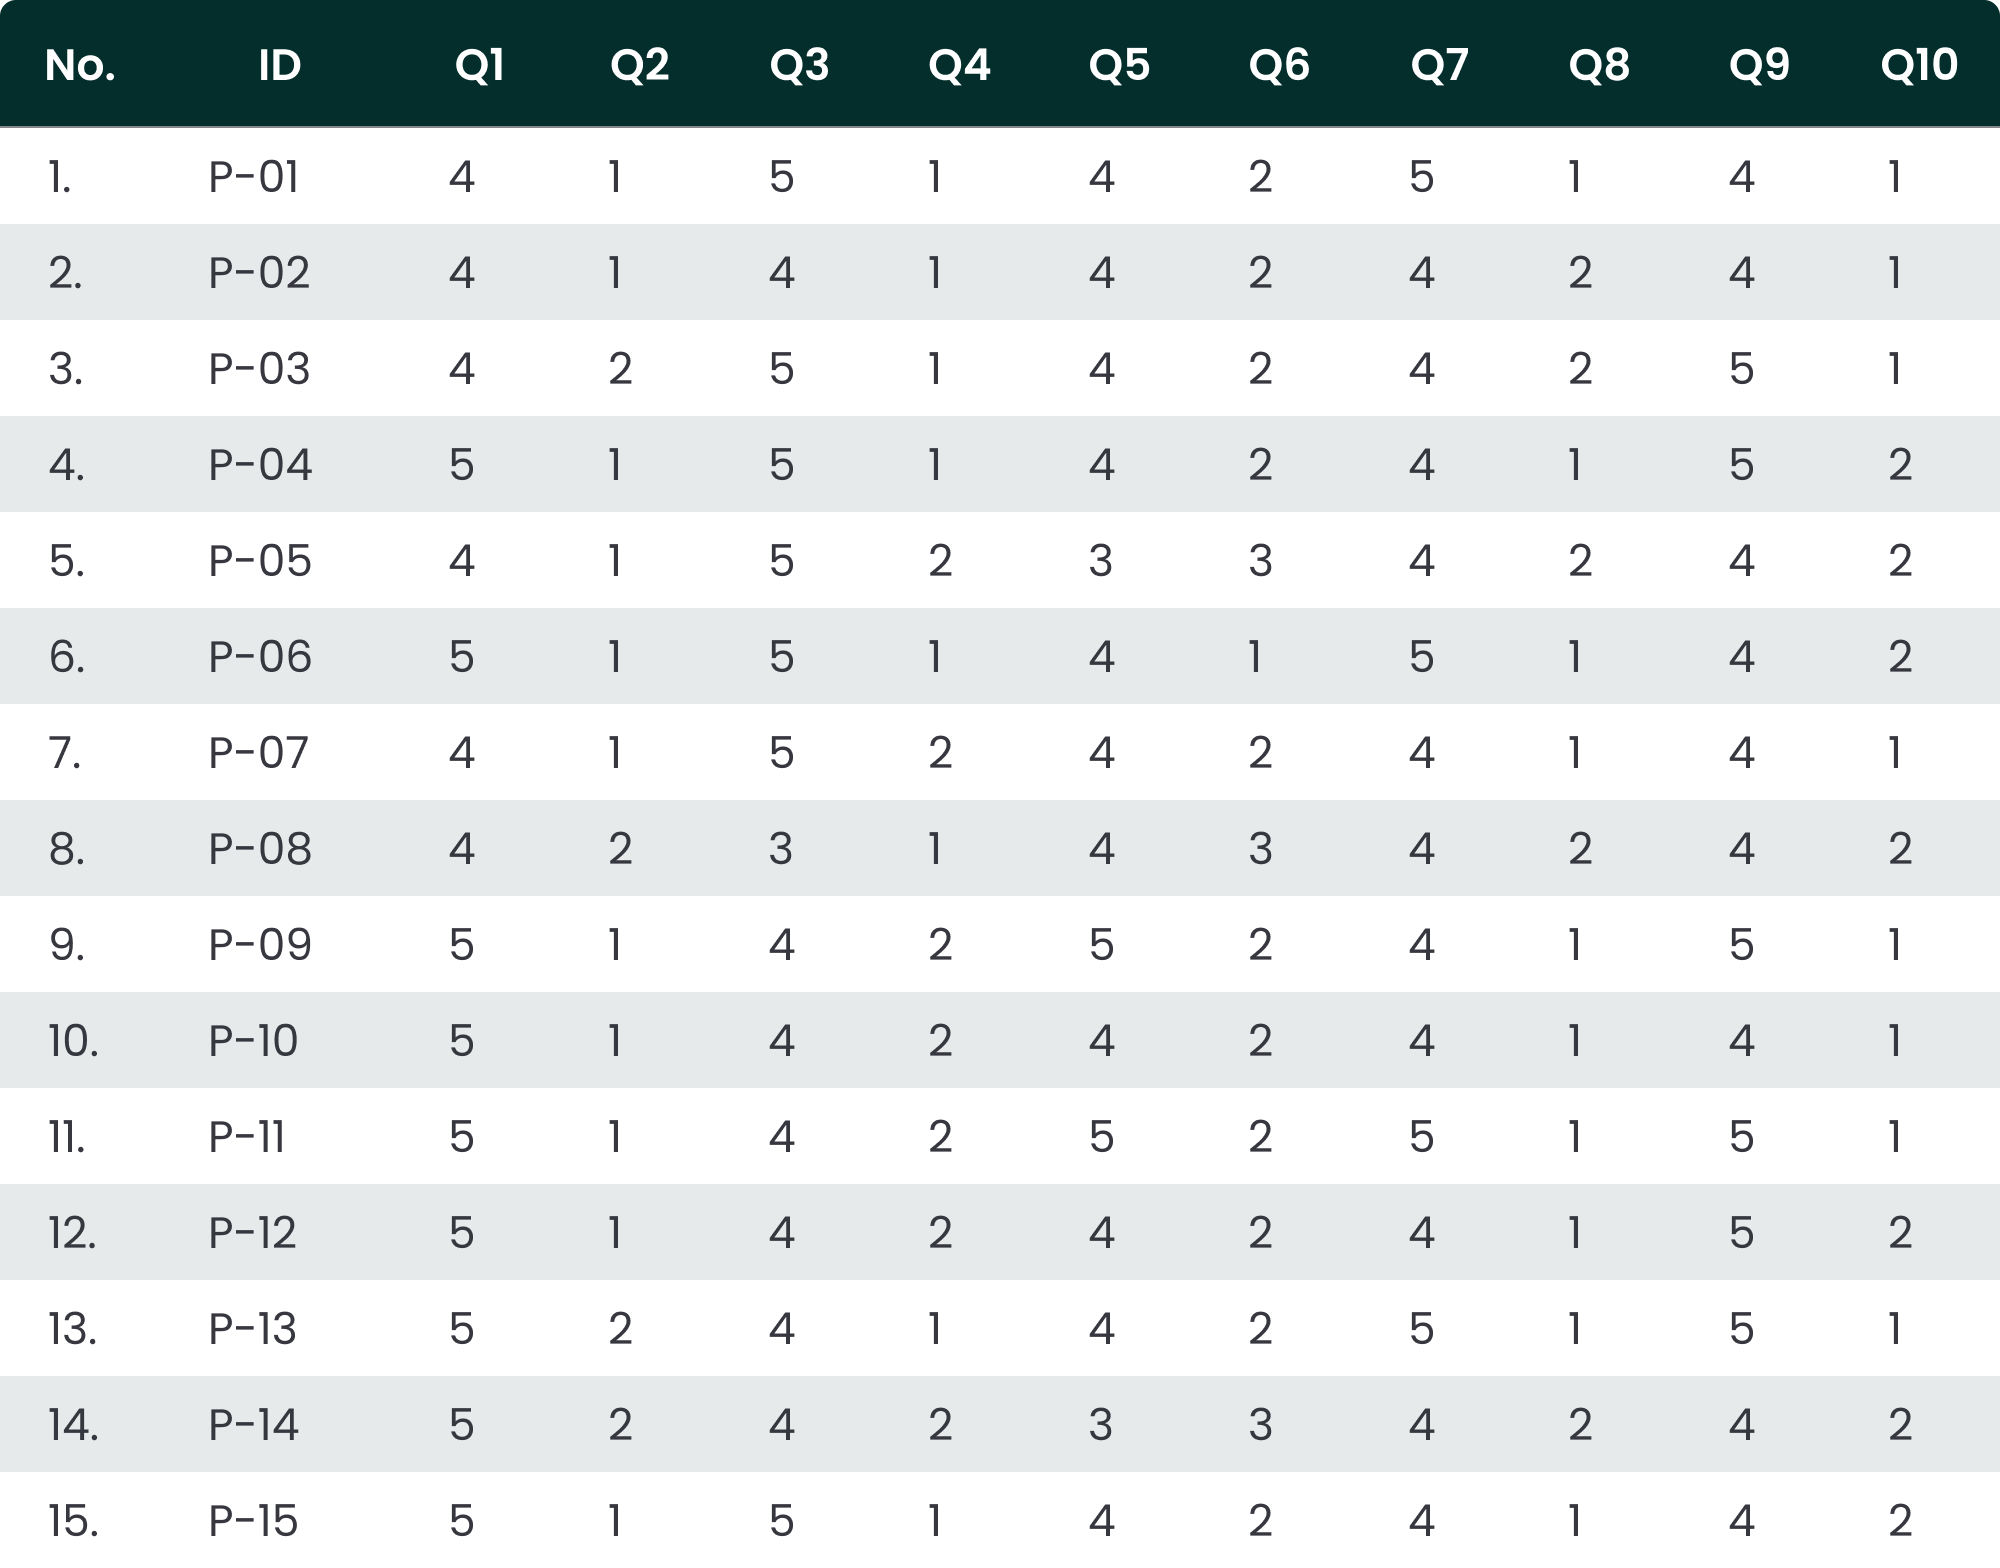
Likert Scale Response Matrix (Raw Data)
The following is the detailed breakdown of the Likert Scale responses (1–5) from the 15 participants:
B. 2.
Summary of Respondents Think-Aloud Protocols
The following is a summary of the findings from the Think-Aloud Protocols conducted with 15 respondents:
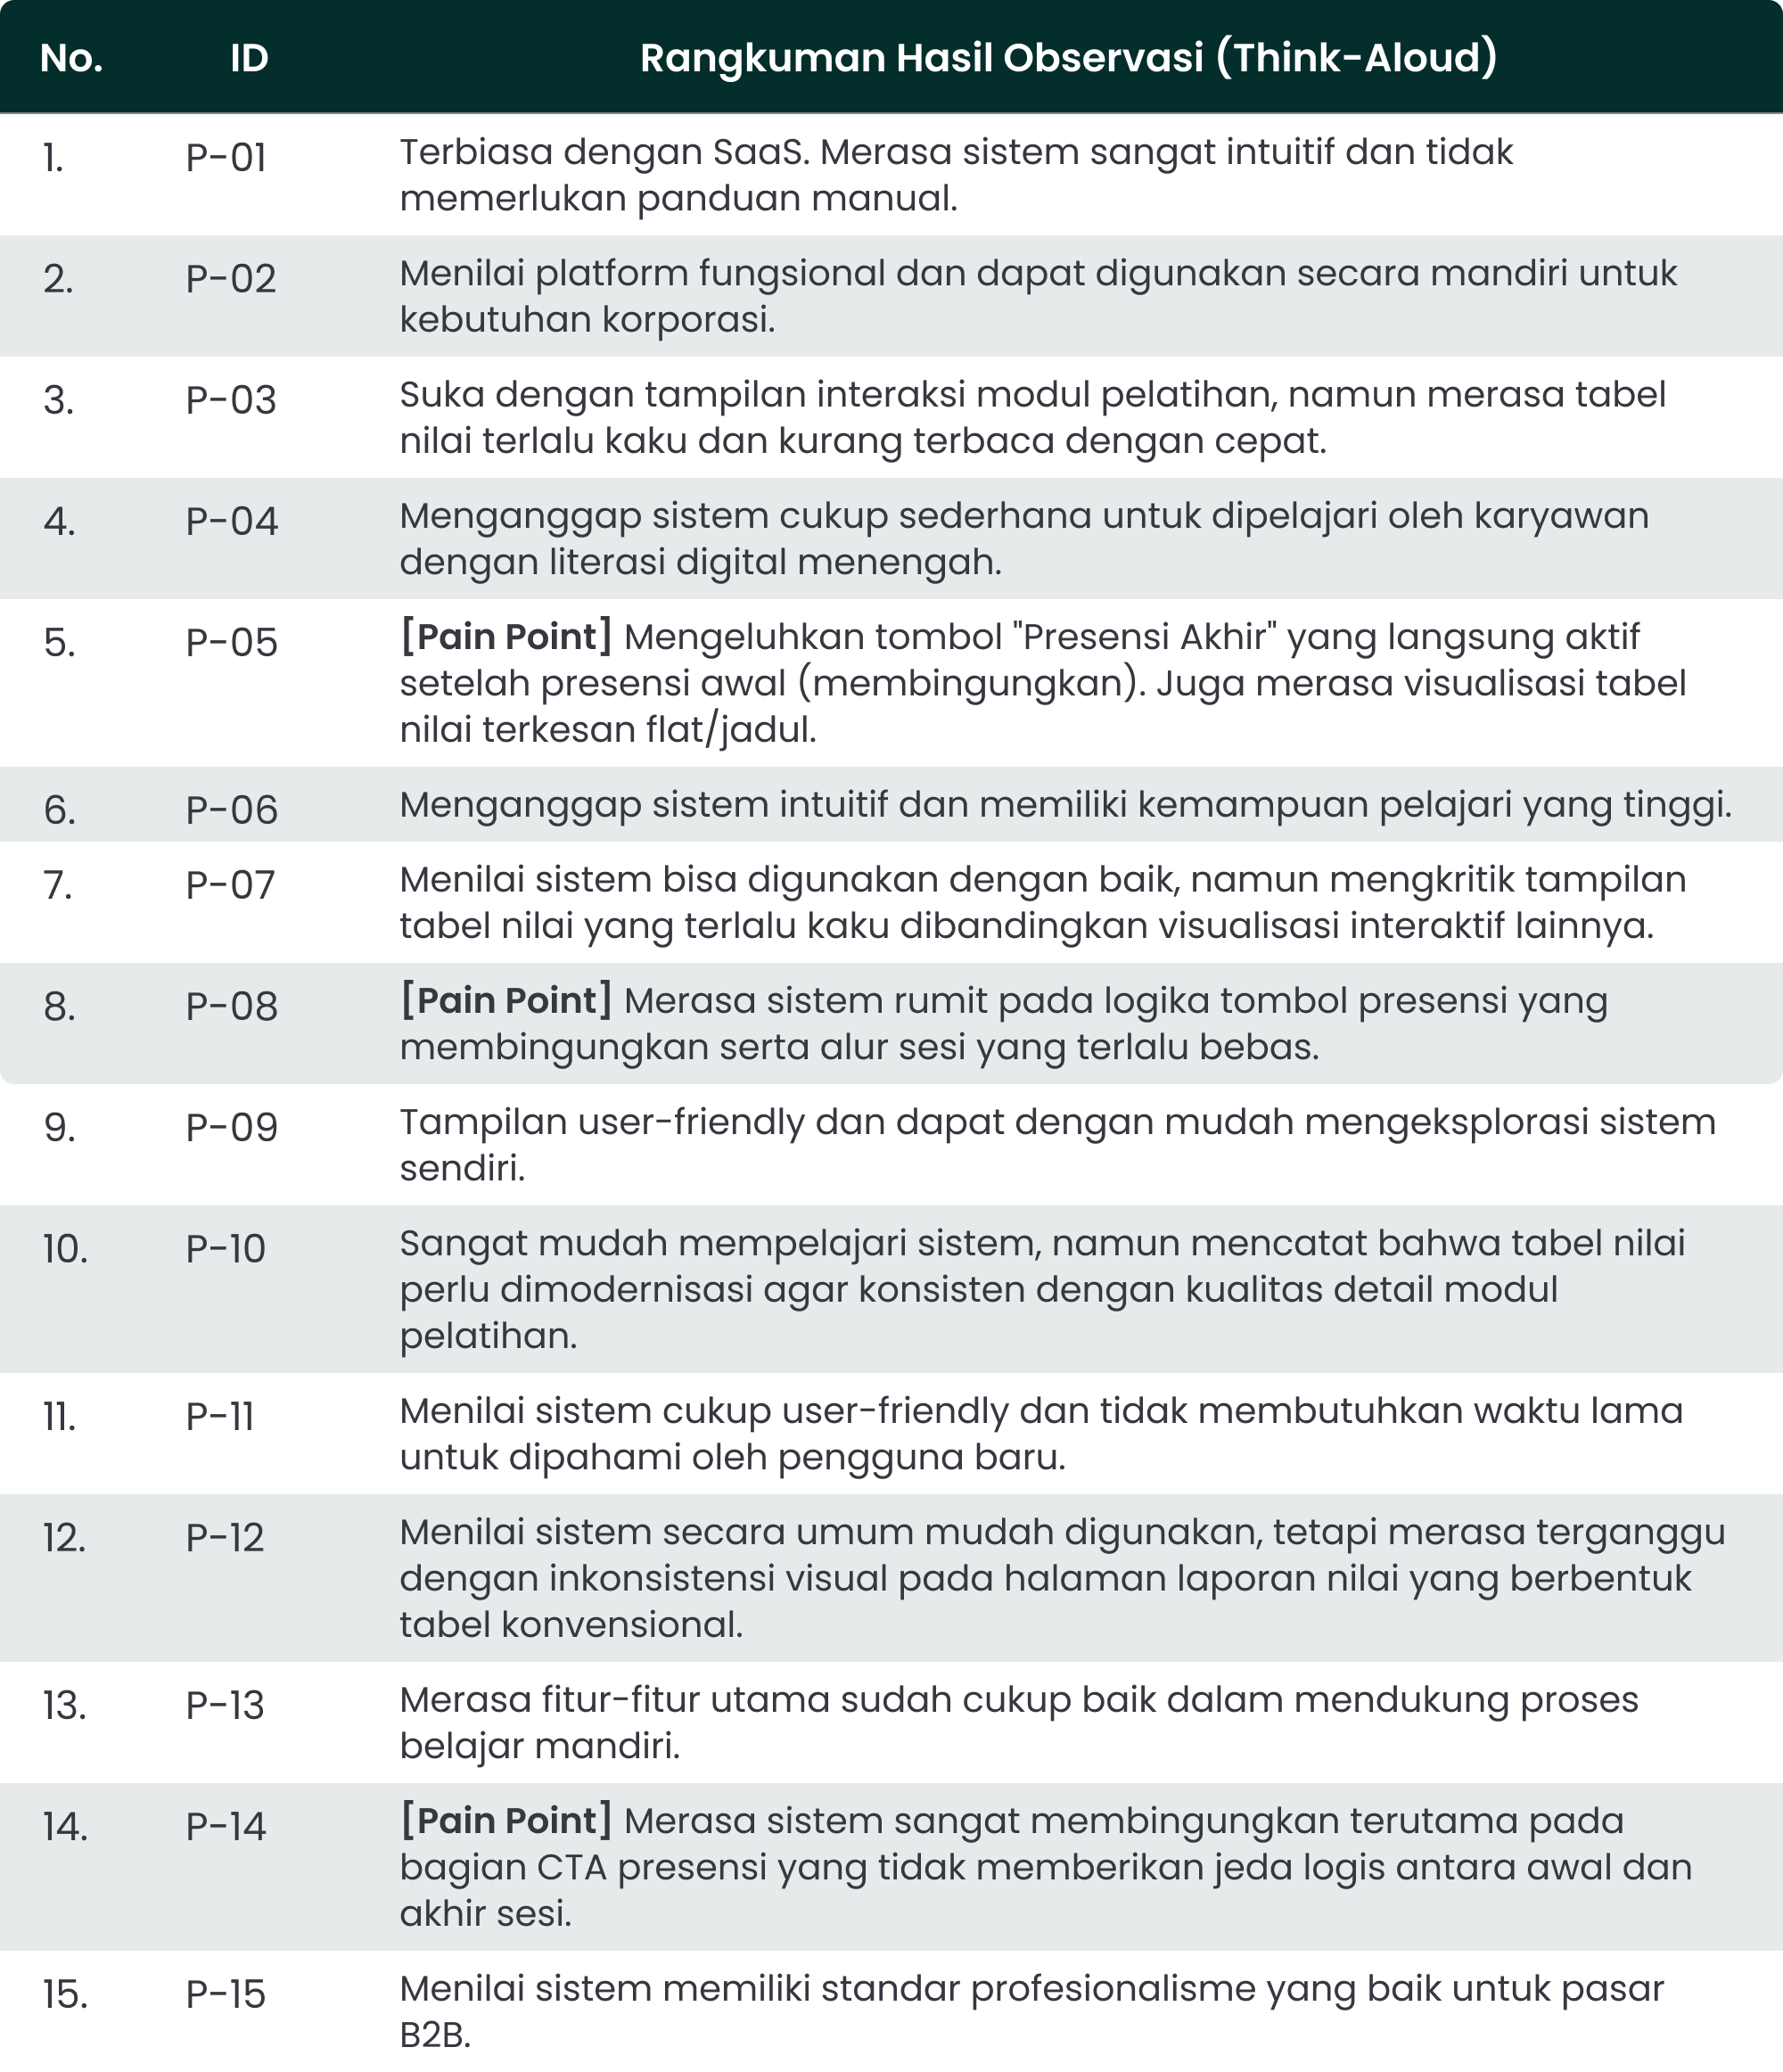

Likert scale responses (raw data) and summary of observation findings (think-aloud) provide objective quantitative and qualitative indicators of system usability.
Phase 4: Data Analysis & Synthesis
This segment focuses on the systematic process of transforming raw data into meaningful information and verifiable insights.
A.
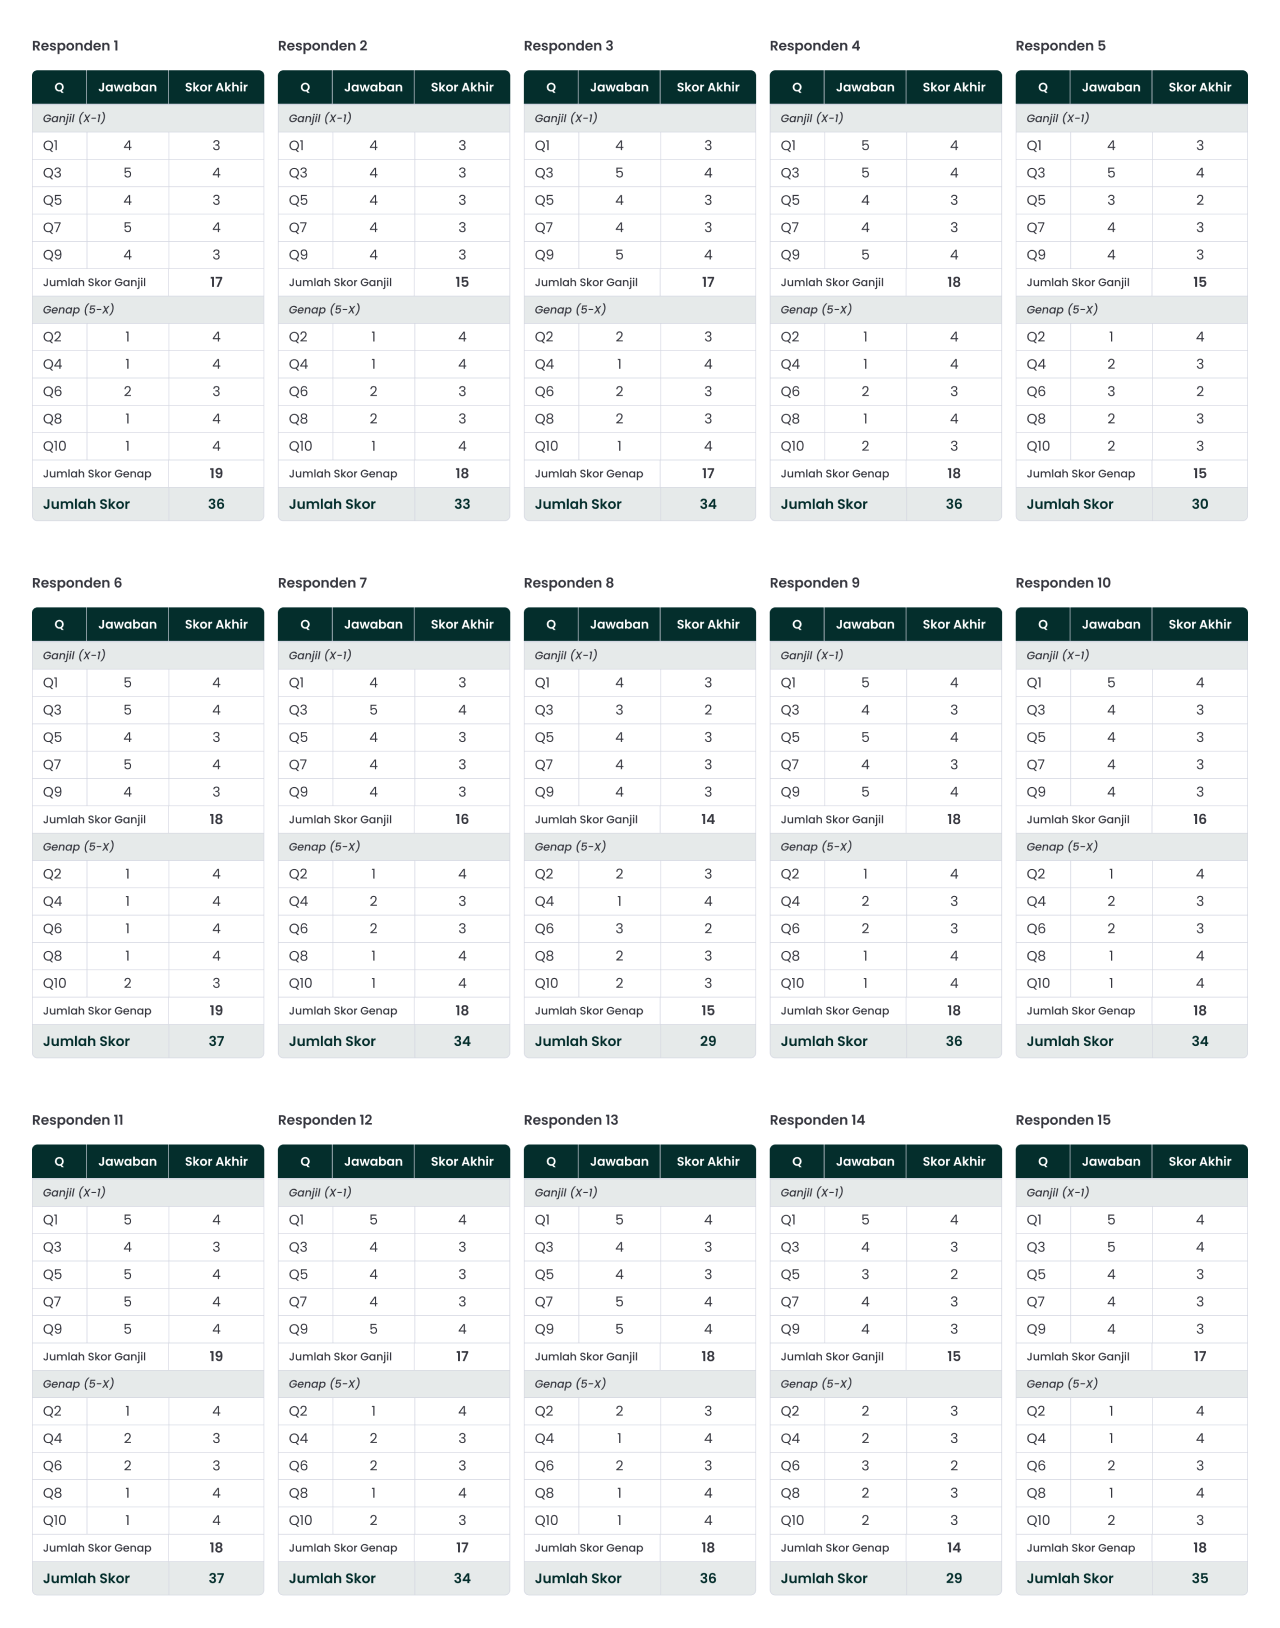
Score Conversion
Converting raw questionnaire data into standardized numerical values to obtain a valid System Usability Scale (SUS) score for each respondent.
B.
Data Calculation
Calculate all individual scores to obtain the final mean value, which determines the system's usability category and overall analysis.
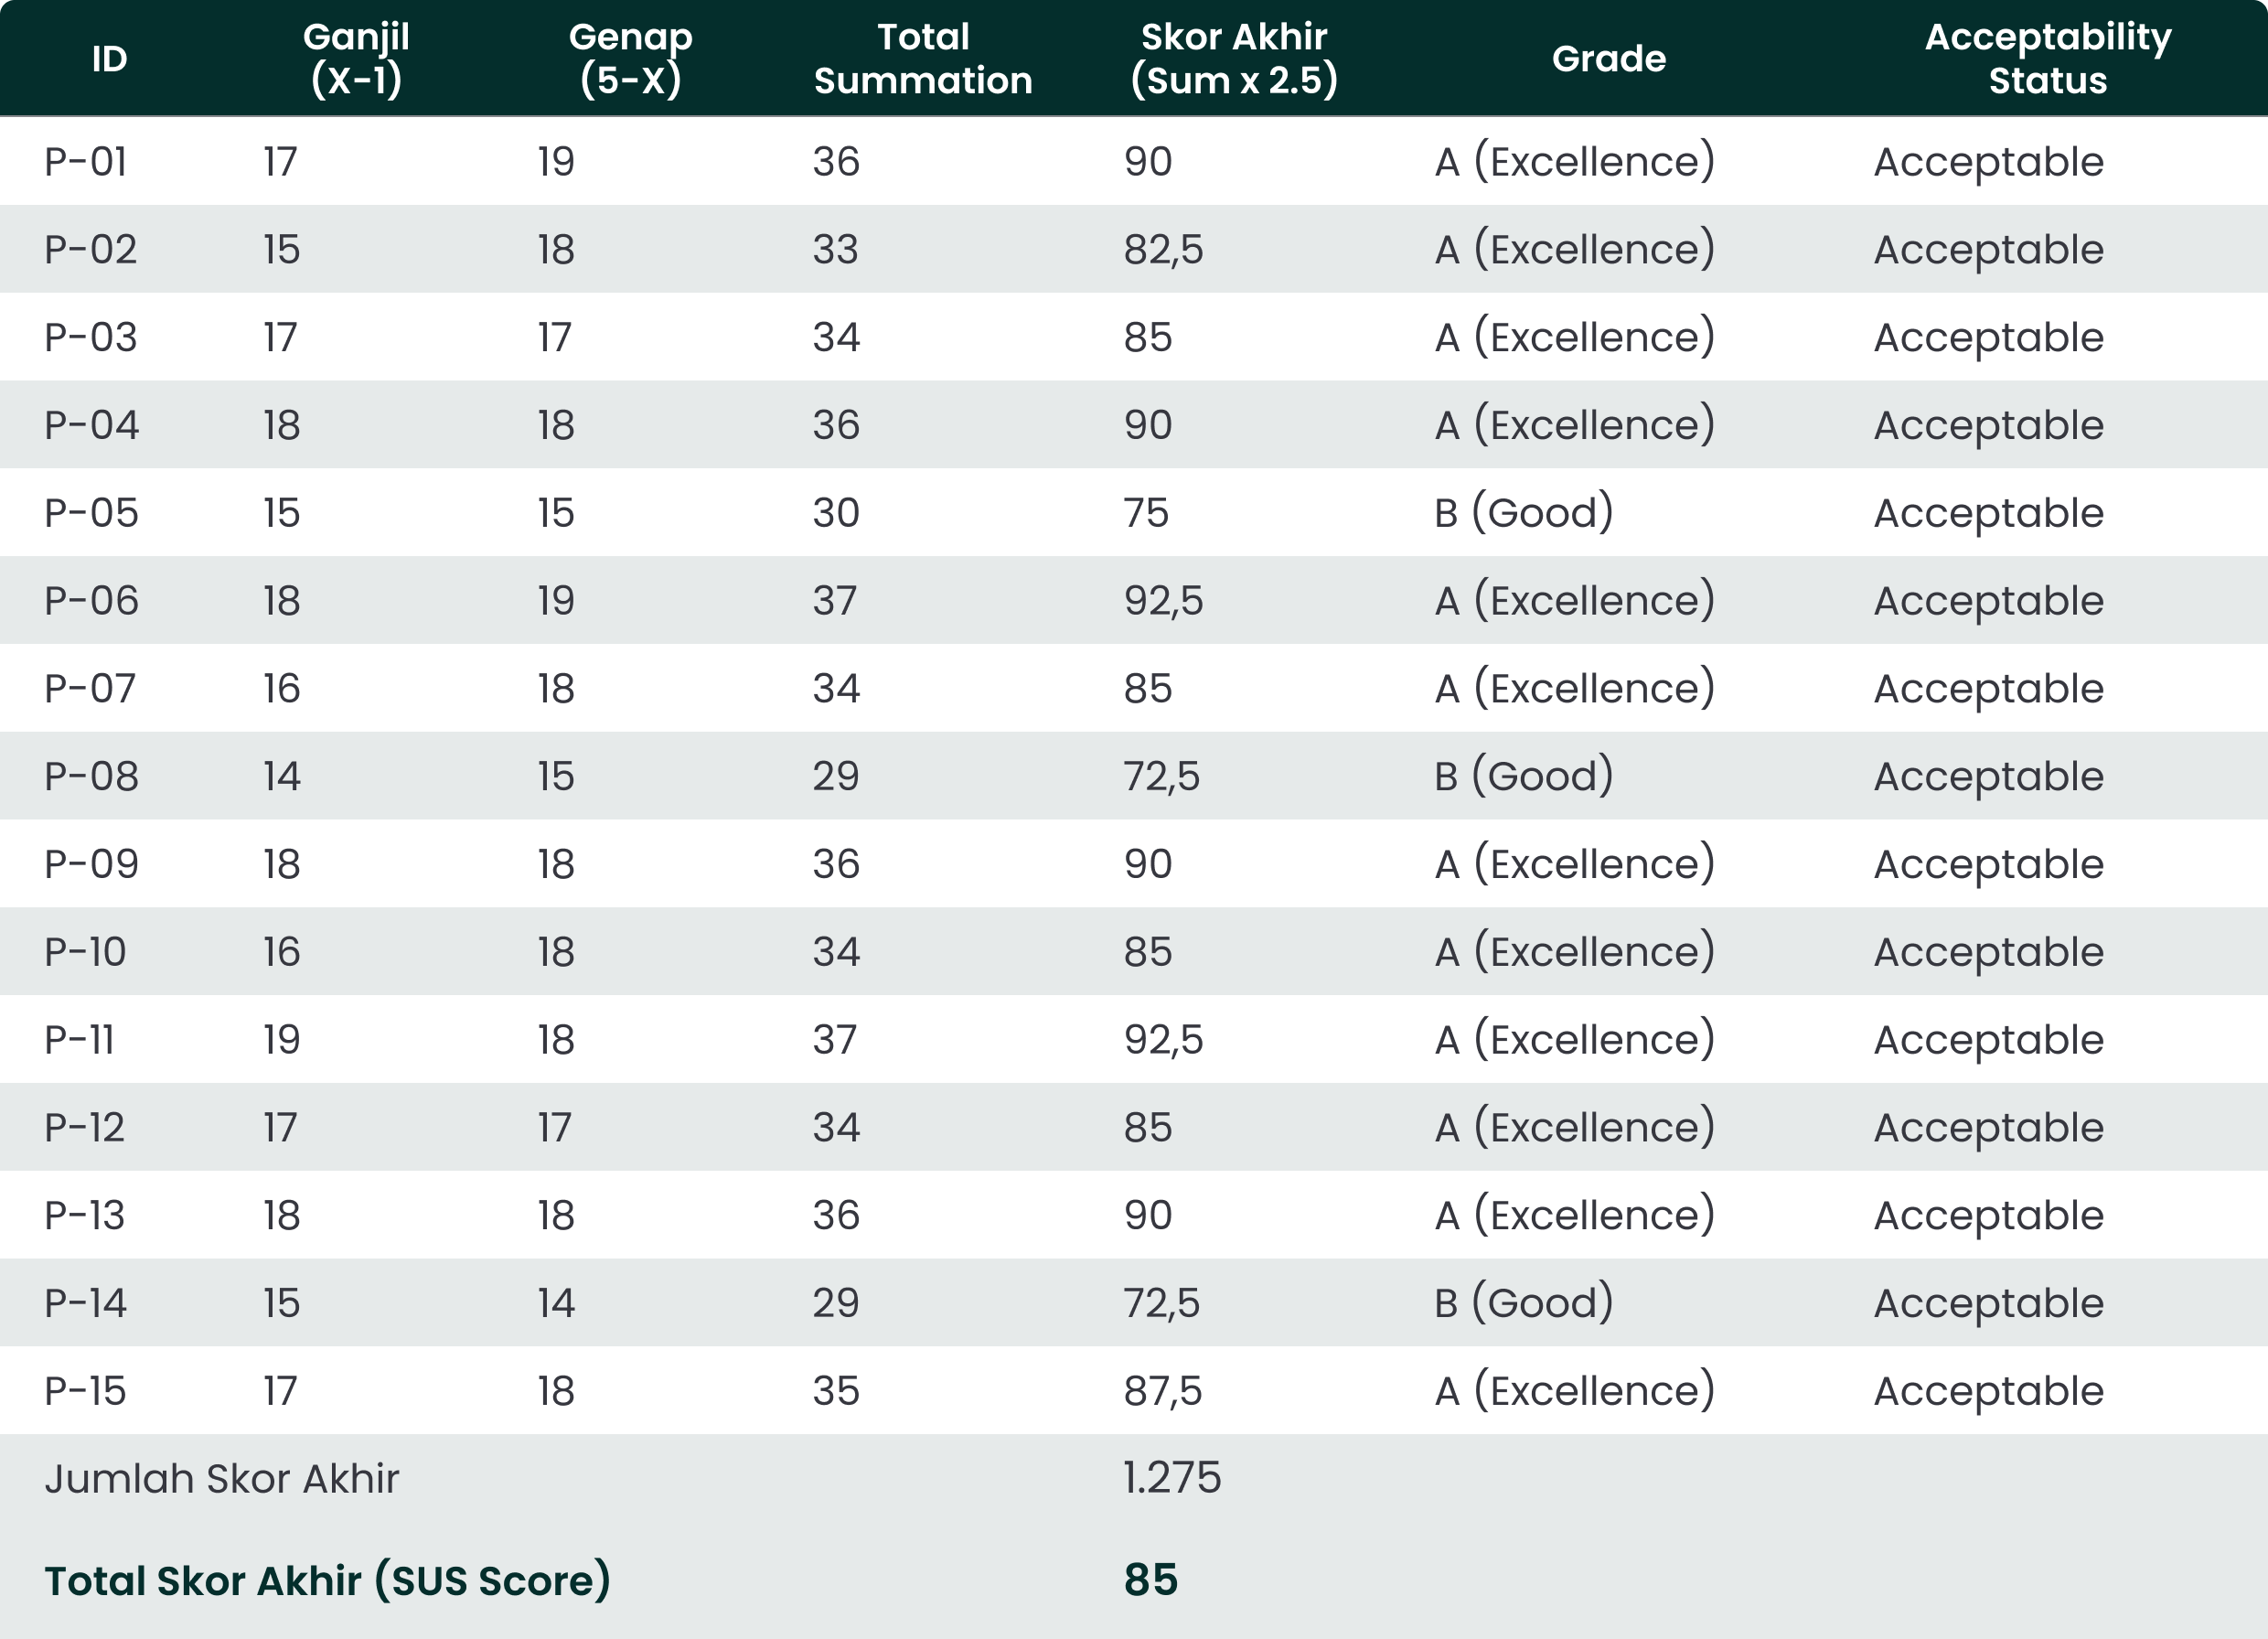
B. 1.
SUS Score Calculation and Summation Table
B. 2.
Quantitative Statistical Analysis
The statistical overview based on data from 15 respondents is as follows:
Highest Score
92.5 (P-06 and P-11), Excellence Category (Acceptable)
Lowest Score
72.5 (P-08 and P-14), Good Category (Acceptable)
Average SUS Score
85
Grade Distribution
- Grade A
:
12 Respondents (80%)
- Grade B
:
3 Respondents (20%)
C.
Synthesis
Research findings reveal a fatal misalignment between the effort required from users and the value provided by the product, with friction emerging at every crucial phase of the user journey.
B2B Market Readiness
A mean score of 85.5 places StellarGens well above the industry average of 68.
Synthesis
The platform is not merely 'usable' but has reached the 'Excellent' category. For B2B partners, this figure provides a guarantee that internal training costs will be minimal, as the system is highly intuitive.
The Minority Gap (Segmentasi Feedback)
While the majority of scores are Grade A, an interesting pattern of negative sentiment emerged from respondents P-05 (75), P-08 (72.5), and P-14 (72.5).
Synthesis
User groups with lower digital literacy or field-work habits still experience minor friction. The Grade B scores in this group confirm previous Think-Aloud findings regarding the Cognitive Load on the attendance button.
Visual Consistency vs. Usability
Respondents such as P-03, P-07, and P-12 provided Grade A scores (85), yet they still noted inconsistencies within the grade tables.
Synthesis
This proves that Visual Inconsistency (Q6) does not compromise system functionality, as users can still complete tasks with ease, though it remains an aesthetic blemish.
Interpreting final score findings and observation results into deep strategic insights regarding user behavior and expectations.
Phase 5: Conclusion & Recommendation
This segment focuses on the conclusions derived from the research activities and the recommendations provided to the relevant departments.
Based on comprehensive testing using the System Usability Scale (SUS) with 15 participants, the StellarGens LMS (B2B) platform achieved a mean score of 85.5. This score places StellarGens (B2B) in the 'Excellent' category (Grade A). These results confirm that the platform possesses a very high adoption rate and is market ready for B2B distribution.
A.
Conclusion (Key Insights)
A summary of key findings that captures the essence of the user experience, providing direct answers to the research questions and defining the strategic direction for future product development.
Insight 1
Operational Efficiency
With 80% of respondents awarding a Grade A, the system is proven to be highly intuitive, allowing client companies to significantly reduce software training costs for their employees.
Insight 2
Cognitive Load
There are score fluctuations (ranging from 72.5 to 75) caused by the attendance button logic, which is perceived to activate too early, triggering momentary user confusion.
Insight 3
Visual Inconsistency
Users identified an aesthetic 'disconnect' on the grade report page, which still utilizes a conventional table format that contrasts sharply with the more modern design of other learning modules.
B.
Recommendations (Action Plans)
These research findings serve as a valuable asset for the Sales team in convincing potential corporate clients of the product's usability guarantee. To achieve a perfect score (>90) and ensure satisfaction across all industry sectors, we recommend:
System Logic
Refining the active duration of the “End Attendance” CTA button to be more contextual.
UI Modernization
Transforming conventional grade tables into interactive data visualizations.
Tactical recommendations designed to mitigate user friction and maximize market opportunities, ensuring every design decision is rooted in valid and measurable data.

Takeaways
Through the execution of this case study, I have gained a profound understanding that successful product development is not built on subjective assumptions or biases. Instead, it requires rigorous validation based on actual user responses—driven by objective quantitative indicators (testing) and complemented by direct observation. Below are my key learning points:
Rapid Validation of B2B Complexity
The SUS framework has proven to be a highly efficient quantitative tool for capturing user perceptions of product complexity. It provides an objective standardization of subjective experiences.
The Necessity of Supplementary Qualitative Context
I realized that the SUS score serves as a “what” indicator, not a “why”. While the final score provides a snapshot of platform performance, supplementary observations or brief interviews remain essential to excavate specific root causes.
Adaptability to B2B User Profiles
Applying SUS in a B2B context requires meticulous participant selection. I learned that a users technical background significantly influences how they interpret the 10 SUS instruments, directly impacting the consistency of the resulting scores.

Handikawj - Product & UI/UX Designer | 2026
Case Study
Product Validation through User Satisfaction & Ease-of-Use Indices for the StellarGens LMS (B2B) Platform.
Project Scope
System Usability Scale (SUS)
Company (Dummy)
StellarGens
Business Field
Edutech
Phase 1: Introduction
This segment focuses on gaining a deep understanding of the problems and needs to be addressed, while clearly defining the research direction and boundaries.
A.
Company Profile
StellarGens (PT Aksara Stellar Generations) is a Jakarta-based edutech and outsourcing startup focused on professional capability development. Its flagship services include training, certification, and human resource solutions. Through innovative strategies, StellarGens empowers organizations and individuals to remain relevant amidst dynamic digital transformations across various industrial sectors.
B.
Business Case
StellarGens is preparing to enter the competitive B2B-Corporate Training market, where cost-effectiveness and performance impact—driven by a Learning Management System (LMS) are top priorities. To prevent low adoption rates caused by complex systems that undermine ROI, StellarGens must conduct comprehensive testing to prove that its product is market-ready and offers a seamless user experience.
C.
Problem Statement
The B2B challenge for StellarGens lies not in its features, but in a complexity that hinders adoption. Without objective quantitative indicators (testing), there is a risk of subjective bias, skyrocketing support costs, and non-renewal of contracts because the system is counter-intuitive and fails to be solution-oriented.
D.
Research Objective
The objective of this research is to validate the viability of the StellarGens LMS to achieve a solid Product-Market Fit, including:
1.
Establishing a Baseline Usability Score
Obtaining a quantitative score (SUS Score) as a benchmark for product quality.
2.
Identifying User Friction Points
Identifying specific workflow segments with the highest user difficulty levels.
3.
Improving the Accuracy of Feature Investment Decisions
Prioritizing UX design improvements before a comprehensive launch.
4.
Providing Sales Enablement Data
Providing scientific validation data for the Sales team to convince B2B prospects of the system's standardized ease-of-use.
Phase 2: Research Design
This segment focuses on the research planning and execution process, serving as a framework for data collection and analysis.
A.
Research Methods
A comprehensive overview of the framework and methodology used to collect data, ensure accurate findings, and objectively validate user needs.
Research Methods
Mix-Methods
The research utilizes an Evaluative approach, moving beyond simple feedback collection to actively observe user responses to the system.
Primary Method
Quantitative Method
Focusing on acquiring a numerical score through the SUS questionnaire.
- Metric
:
SUS Score (0-100)
- Analysis
:
Descriptive Statistics (Mean and Percentiles).
Supporting Method
Qualitative Method
Integrated with Usability Testing to observe and analyze user behavior.
- Method
:
Think-Aloud Protocol
- Analysis
:
Identifying the pain points causing a low SUS Score.
B.
Population & Sample
Defining target user profiles and participant criteria to ensure that the collected data remains relevant to the product ecosystem.
C.
Implementation Timeline
A detailed work plan mapping out every research phase, from preparation to final reporting, to ensure the project stays on schedule.
D.
Research Instrument
A list of tools and structured guides used for consistent data collection, ensuring that every participant interaction yields valid and measurable information.
Usability Testing (Tasks)
1.
Melakukan Login & menemukan modul pelatihan.
2.
(Learning Interaction) User dapat mengeksplorasi jadwal pelatihan, melakukan presensi, mengakses materi, & menyelesaikan evaluasi pelatihan.
3.
Mengakses Training Progress, Assessment & Certificate.
System Usability Test Questionnaires
Instrument 10 pernyataan baku yang diisi dengan Skala Linkert (1-5):
1.
Saya rasa saya akan sering menggunakan platform ini.
2.
Saya merasa platform ini rumit tanpa alasan yang jelas.
3.
Saya rasa platform ini mudah digunakan.
4.
Saya rasa saya akan membutuhkan bantuan dari orang teknis untuk dapat menggunakan platform ini.
5.
Saya merasa berbagai fungsi dalam platform ini terintegrasi dengan baik.
6.
Saya rasa ada terlalu banyak ketidakkonsistenan dalam platform ini.
7.
Saya membayangkan kebanyakan orang akan belajar menggunakan platform ini dengan sangat cepat.
8.
Saya merasa platform ini sangat sulit/canggung untuk digunakan.
9.
Saya merasa sangat percaya diri saat menggunakan platform ini.
10.
Saya perlu mempelajari banyak hal sebelum saya bisa mulai menggunakan platform ini.
E.
Research Procedure
A series of systematic steps conducted in sequence, from preparation to data processing, to ensure integrity and consistency throughout the research process.
Phase 3: Data Collection
This segment focuses on the implementation of the research design to acquire and collect data.
A.
Participants & Research Schedule
List of participants and a summary of the research session schedule to ensure efficient data collection.
The following is the distribution of 15 participants, strategically selected to cover a diverse range of industry sectors and an age bracket of 24–40 years:
B.
Data Scoring
B. 1.
Likert Scale Response Matrix (Raw Data)
The following is the detailed breakdown of the Likert Scale responses (1–5) from the 15 participants:
B. 2.
Summary of Respondents Think-Aloud Protocols
The following is a summary of the findings from the Think-Aloud Protocols conducted with 15 respondents:
Likert scale responses (raw data) and summary of observation findings (think-aloud) provide objective quantitative and qualitative indicators of system usability.
Phase 4: Data Analysis & Synthesis
This segment focuses on the systematic process of transforming raw data into meaningful information and verifiable insights.
A.
Score Conversion
Converting raw questionnaire data into standardized numerical values to obtain a valid System Usability Scale (SUS) score for each respondent.
B.
Data Calculation
Calculate all individual scores to obtain the final mean value, which determines the system's usability category and overall analysis.
B. 1.
SUS Score Calculation and Summation Table
B. 2.
Quantitative Statistical Analysis
The statistical overview based on data from 15 respondents is as follows:
Highest Score
92.5 (P-06 and P-11), Excellence Category (Acceptable)
Lowest Score
72.5 (P-08 and P-14), Good Category (Acceptable)
Average SUS Score
85
Grade Distribution
- Grade A
:
12 Respondents (80%)
- Grade B
:
3 Respondents (20%)
C.
Synthesis
Research findings reveal a fatal misalignment between the effort required from users and the value provided by the product, with friction emerging at every crucial phase of the user journey.
B2B Market Readiness
A mean score of 85.5 places StellarGens well above the industry average of 68.
Synthesis
The platform is not merely 'usable' but has reached the 'Excellent' category. For B2B partners, this figure provides a guarantee that internal training costs will be minimal, as the system is highly intuitive.
The Minority Gap (Segmentasi Feedback)
While the majority of scores are Grade A, an interesting pattern of negative sentiment emerged from respondents P-05 (75), P-08 (72.5), and P-14 (72.5).
Synthesis
User groups with lower digital literacy or field-work habits still experience minor friction. The Grade B scores in this group confirm previous Think-Aloud findings regarding the Cognitive Load on the attendance button.
Visual Consistency vs. Usability
Respondents such as P-03, P-07, and P-12 provided Grade A scores (85), yet they still noted inconsistencies within the grade tables.
Synthesis
This proves that Visual Inconsistency (Q6) does not compromise system functionality, as users can still complete tasks with ease, though it remains an aesthetic blemish.
Interpreting final score findings and observation results into deep strategic insights regarding user behavior and expectations.
Phase 5: Conclusion & Recommendation
This segment focuses on the conclusions derived from the research activities and the recommendations provided to the relevant departments.
Based on comprehensive testing using the System Usability Scale (SUS) with 15 participants, the StellarGens LMS (B2B) platform achieved a mean score of 85.5. This score places StellarGens (B2B) in the 'Excellent' category (Grade A). These results confirm that the platform possesses a very high adoption rate and is market ready for B2B distribution.
A.
Conclusion (Key Insights)
A summary of key findings that captures the essence of the user experience, providing direct answers to the research questions and defining the strategic direction for future product development.
Insight 1
Operational Efficiency
With 80% of respondents awarding a Grade A, the system is proven to be highly intuitive, allowing client companies to significantly reduce software training costs for their employees.
Insight 2
Cognitive Load
There are score fluctuations (ranging from 72.5 to 75) caused by the attendance button logic, which is perceived to activate too early, triggering momentary user confusion.
Insight 3
Visual Inconsistency
Users identified an aesthetic 'disconnect' on the grade report page, which still utilizes a conventional table format that contrasts sharply with the more modern design of other learning modules.
B.
Recommendations (Action Plans)
These research findings serve as a valuable asset for the Sales team in convincing potential corporate clients of the product's usability guarantee. To achieve a perfect score (>90) and ensure satisfaction across all industry sectors, we recommend:
System Logic
Refining the active duration of the “End Attendance” CTA button to be more contextual.
UI Modernization
Transforming conventional grade tables into interactive data visualizations.
Tactical recommendations designed to mitigate user friction and maximize market opportunities, ensuring every design decision is rooted in valid and measurable data.
Takeaways
Through the execution of this case study, I have gained a profound understanding that successful product development is not built on subjective assumptions or biases. Instead, it requires rigorous validation based on actual user responses—driven by objective quantitative indicators (testing) and complemented by direct observation. Below are my key learning points:
Rapid Validation of B2B Complexity
The SUS framework has proven to be a highly efficient quantitative tool for capturing user perceptions of product complexity. It provides an objective standardization of subjective experiences.
The Necessity of Supplementary Qualitative Context
I realized that the SUS score serves as a “what” indicator, not a “why”. While the final score provides a snapshot of platform performance, supplementary observations or brief interviews remain essential to excavate specific root causes.
Adaptability to B2B User Profiles
Applying SUS in a B2B context requires meticulous participant selection. I learned that a users technical background significantly influences how they interpret the 10 SUS instruments, directly impacting the consistency of the resulting scores.
Handikawj - Product & UI/UX Designer | 2026